
Every 10 years, NOAA releases an updated analysis on our climate data here in the United States.
This data is what we meteorologists reference to almost every single day.
What is today's normal? What is the average high? How much rain do we average in May? How much of a rain deficit are we at for the month right now?
These are all questions that are derived from these climate normals.
The normals are comprised of 30 years worth of data, which gets updated every 10 years. The reason for this is because this 30 year data best reflects what is normal or average in our current climate.
The weather is always changing and as a result, so is our climate. The weather is what is happening right now while climate is what has happened in the past.
For example, our most recent climate averages were from 1981-2010. With the recent data analysis from NOAA, our new normals are based on the previous weather from 1991 to 2020.
Essentially, we got rid of the data for Columbus from the 1980's and replaced it with the data from the 2010's.
So what are the findings? They shouldn't be surprising.

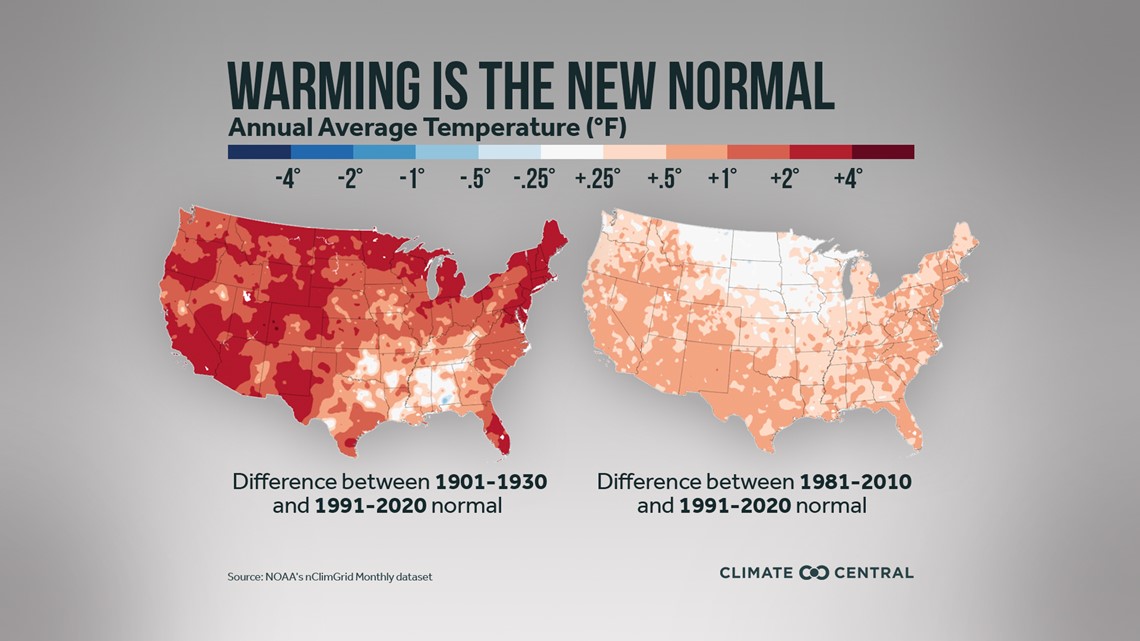
Comparing the most recent 30 year average to the start of the 20th century there is a big jump in temperatures, about a 2-4 degree increase in annual average temperature.
There's even a .5 to 1 degree increase in just comparing the most recent data set to the new one.

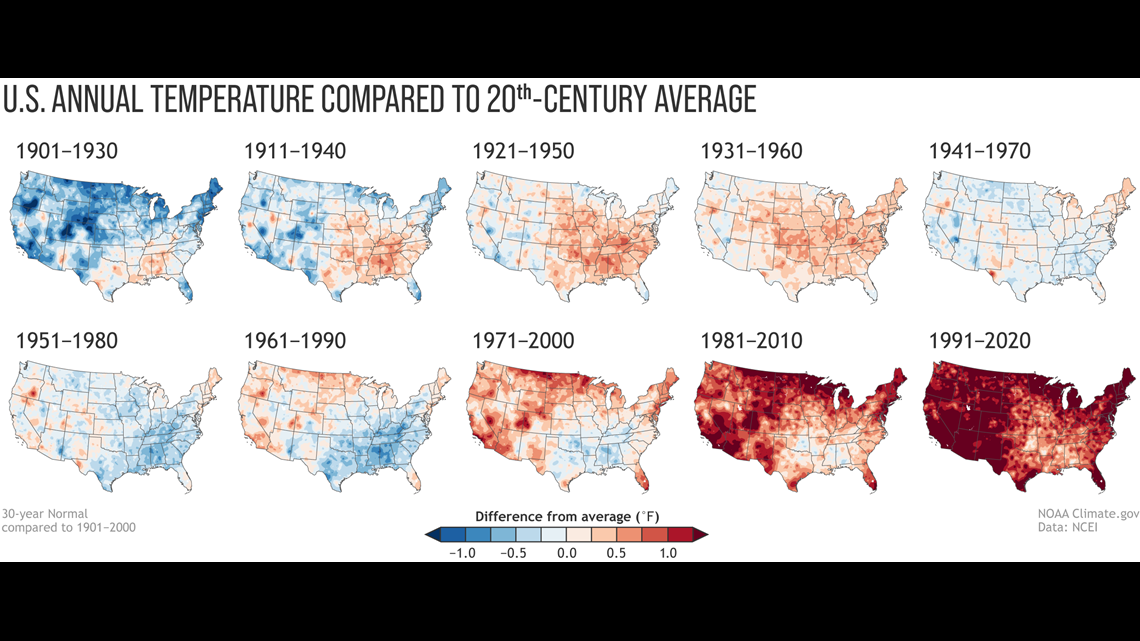
This difference can be easily noted by simply comparing the 30 year averages over the years compared the the 20th century average.

Not only is it warmer, but it's wetter for much of the country. Columbus has also seen these changes locally.

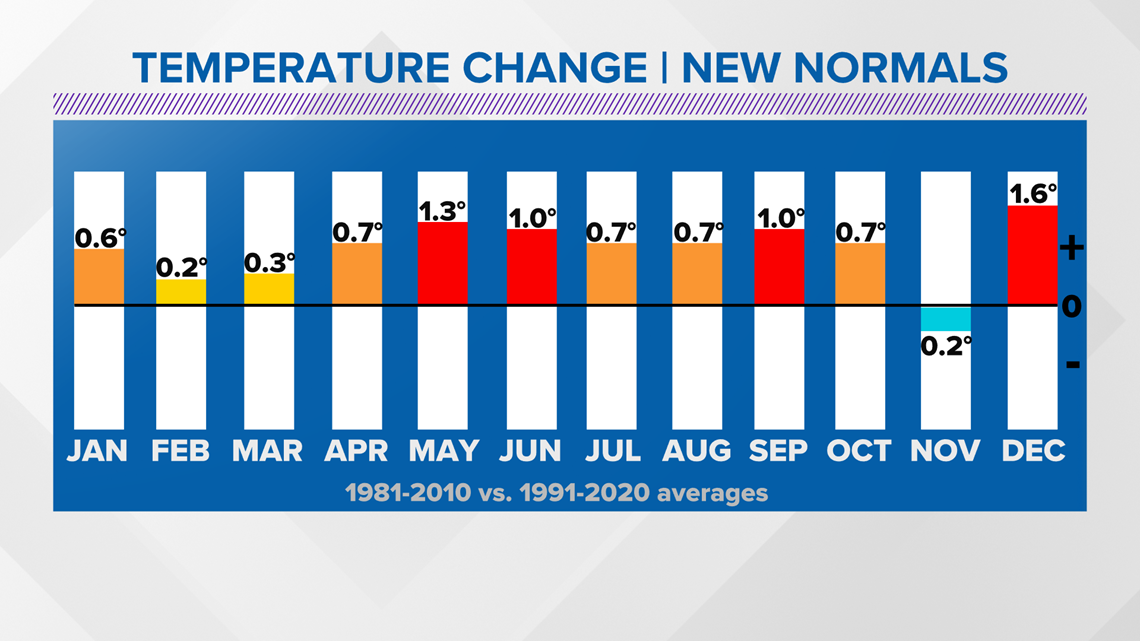
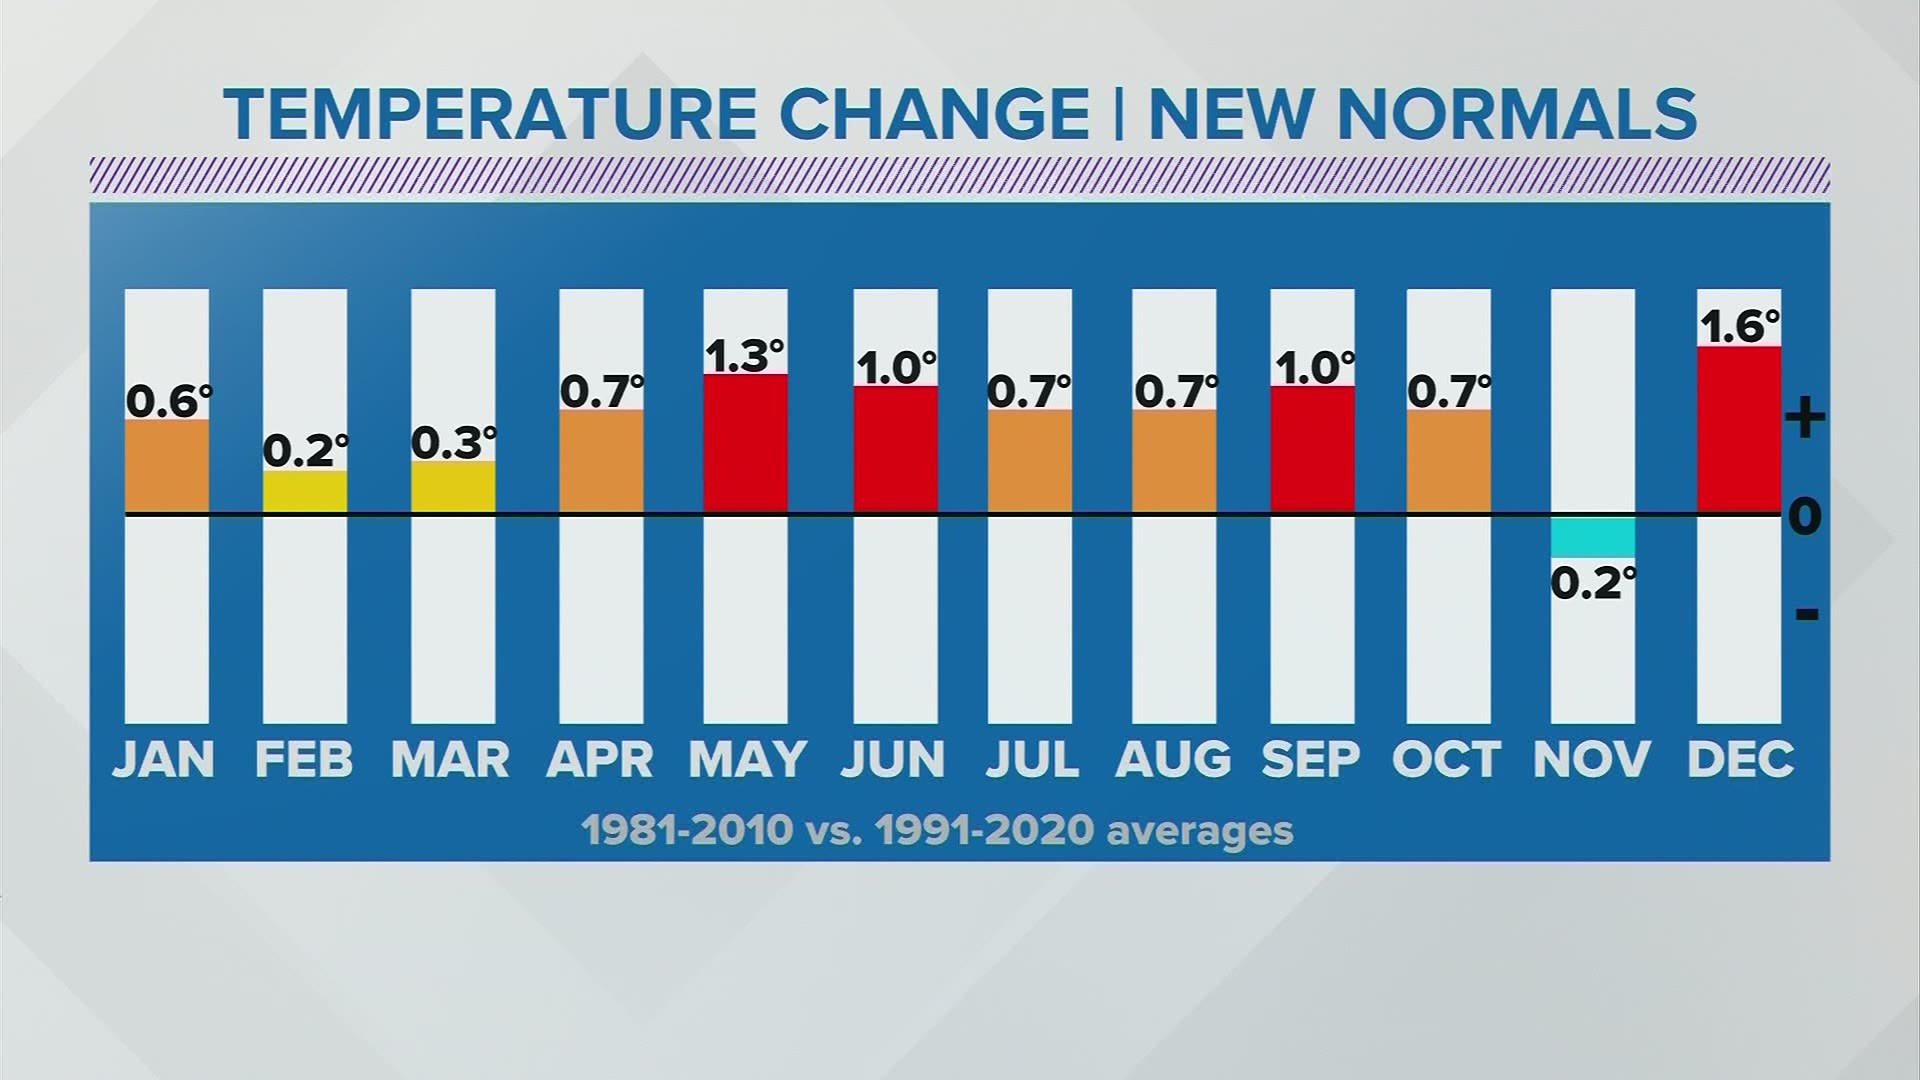
Our only month that hasn't seen an increase in average temperature is November, but our average annual temperature increase is 0.7 degrees compared to the 1981-2010 data.
Notice how our biggest warm ups are in the months of December, May, June and September.

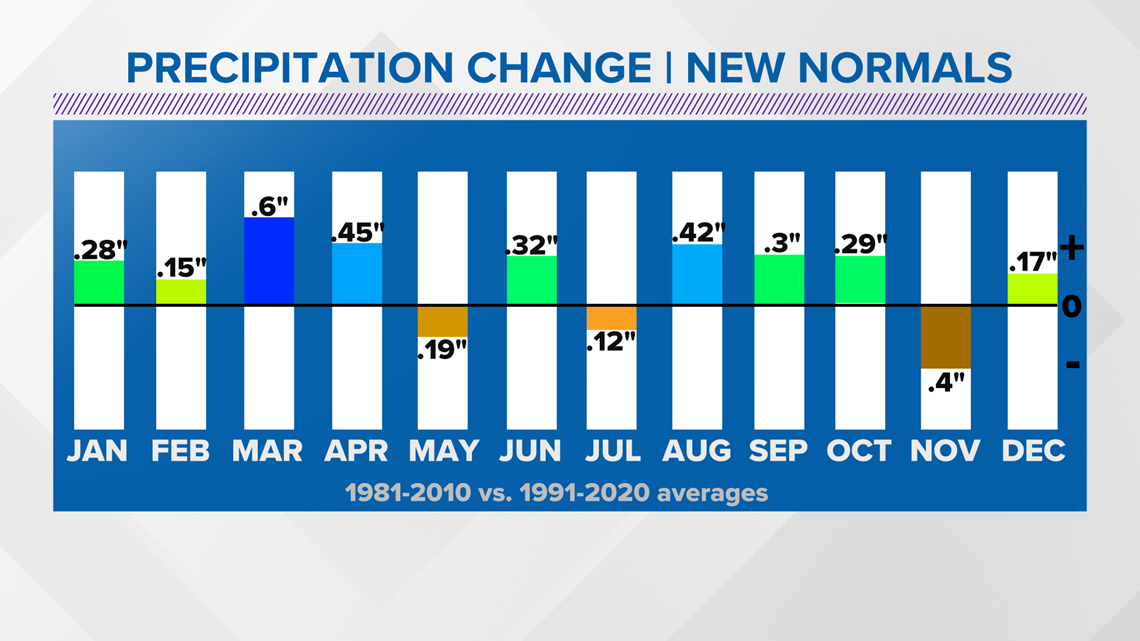
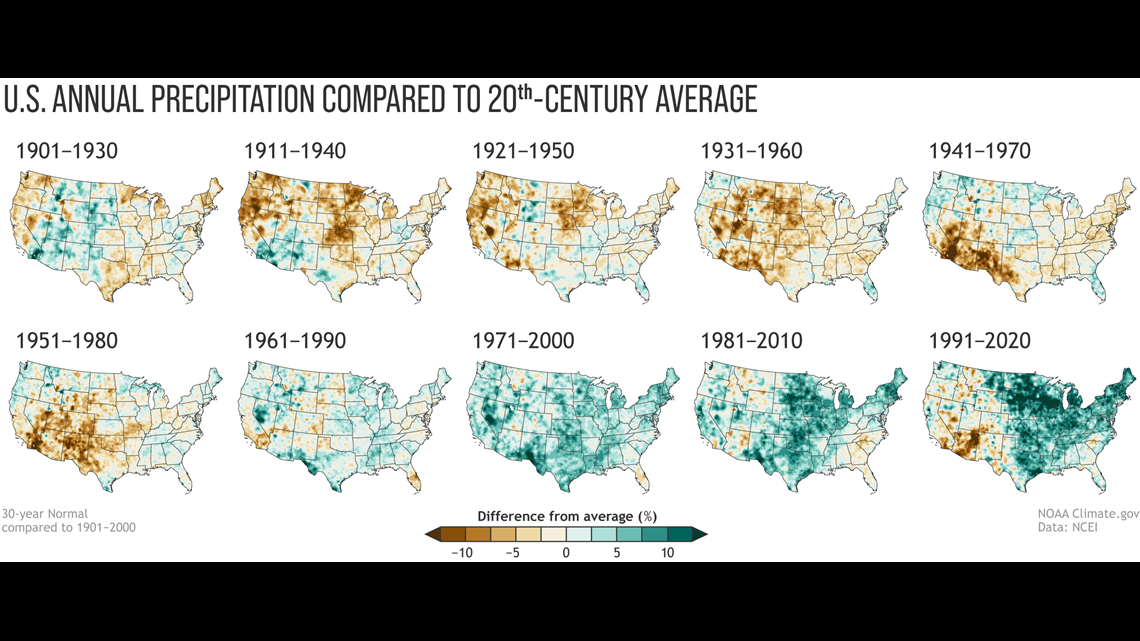
Precipitation is also a big increase across Ohio, especially in the spring months.
Lesser amounts are seen in May & July, but these are or were the wettest months to begin with when looking at our 1981-2010 data set.

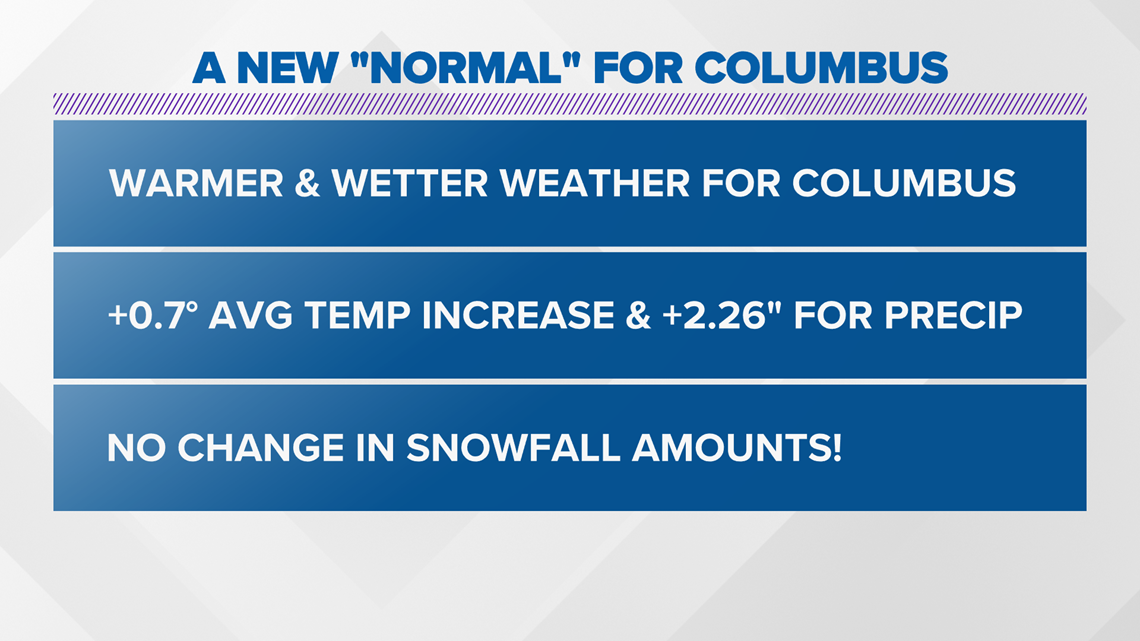
Interestingly enough, our snowfall averages are still the same and were unaffected by the data change. Rainfall, however has increased and while that may seem like a good thing for agriculture, data has suggested that we're also seeing more downpours with the changing climate.
Rain is a good thing, but it can be bad when there's a lot in a small amount of time.
Temperatures are also warmer. A 0.7 degrees increase in the newest data.
The biggest increase in temperatures has been noted in our overnight low temperatures when compared to our daytime highs.
Our previous average annual low was 43.5 degrees and now it's 44.4 degrees, which is an increase of 0.9 degrees.
Our previous average annual high was 62.5 degrees and now it's 63.0 degrees, which is an increase of 0.5 degrees.
This means that our nighttime lows aren't as cold as what they used to be and our daytime highs are a little warmer.
These new normals suggest that we now have a higher threshold for what is considered above average. In theory this means that we shouldn't see as many above average days because we are accounting for the increase in what we consider to be "normal" in our weather now.
The bottom line is that we are seeing more "warmer" and "wetter" weather here in Columbus and across much of the country.